Exoplanet-Visualization
🪐 Exoplanet Discovery Timeline & ESI Calculator
Interactive data visualization project that analyzes NASA’s exoplanet archive to identify potentially habitable worlds using the Earth Similarity Index (ESI).
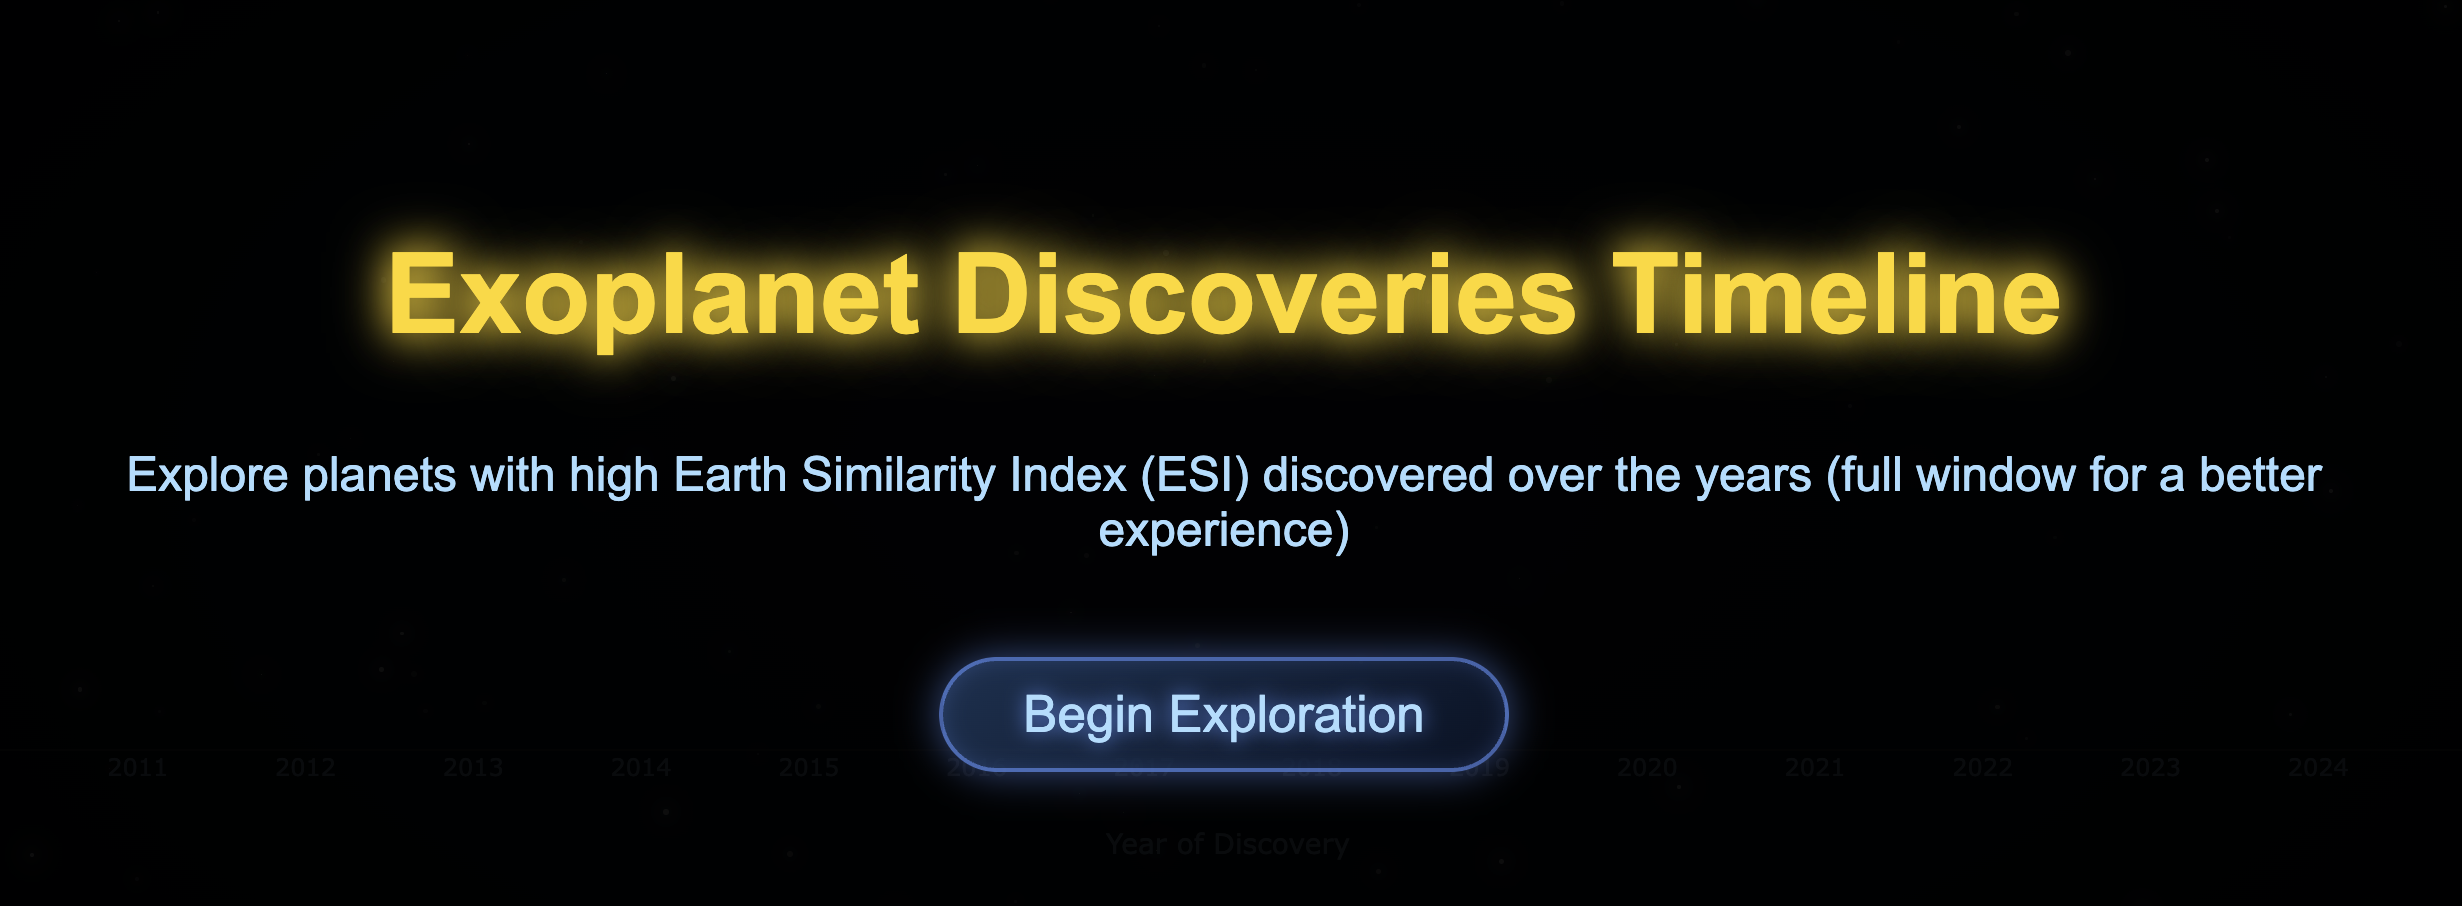
📊 Overview
This project combines Data Science with Web Visualization to explore the history of exoplanet discoveries.
- Data Processing: Python scripts ingest raw NASA data, cleaning and filtering candidates.
- Math Modeling: Calculates the Earth Similarity Index based on planetary radius, density, escape velocity, and surface temperature.
- Visualization: An interactive D3.js/JS timeline allowing users to explore the universe’s candidates.
🧮 The Math: Earth Similarity Index (ESI)
The core of the analysis is the ESI formula, implemented in Python:
\[ESI = \prod_{i=1}^{n} \left(1 - \left| \frac{x_i - x_{i0}}{x_i + x_{i0}} \right| \right)^{\frac{w_i}{n}}\](See compute_esi.py for implementation details)
🛠️ Tech Stack
- Backend / Processing: Python 3, Pandas, NumPy, Flask.
- Frontend: HTML5, CSS3, Vanilla JavaScript.
- Data Source: NASA Exoplanet Archive.
🚀 How to Run Locally
-
Clone the repository:
git clone [https://github.com/alvarorm3008/VISUALIZATION-UIB.git](https://github.com/alvarorm3008/Exoplanet-Visualization.git) cd Exoplanet-Visualization -
Set up the environment:
python3 -m venv venv source venv/bin/activate # On Windows: venv\Scripts\activate pip install -r requirements.txt -
Launch the Visualization:
python serving_archivos.pyOpen your browser at
http://127.0.0.1:5000/timeline.html
Author: Alvaro Rodriguez and Agustin Soares